- 1 Key Takeaways
- 2 Methodology: How was the study conducted?
- 3 Key Players in Tilapia (Oreochromis niloticus) Nutrition Science
- 4 Thematic Knowledge Map of Tilapia Nutrition
- 5 Technological Appropriation: Who Files Patents?
- 6 Cross-Analysis of Science and Patents
- 7 Conclusions
-
8
Frequently Asked Questions (FAQ)
- 8.1 Who leads scientific production and patenting in tilapia nutrition?
- 8.2 Is Moringa a good investment opportunity for functional tilapia feeds?
- 8.3 Where are the best uncontested innovation opportunities in tilapia nutrition located?
- 8.4 What are the main technological trends in Nile tilapia nutrition for the next 4 to 7 years?
- 9 References
- 10 Entradas relacionadas:
Key Takeaways
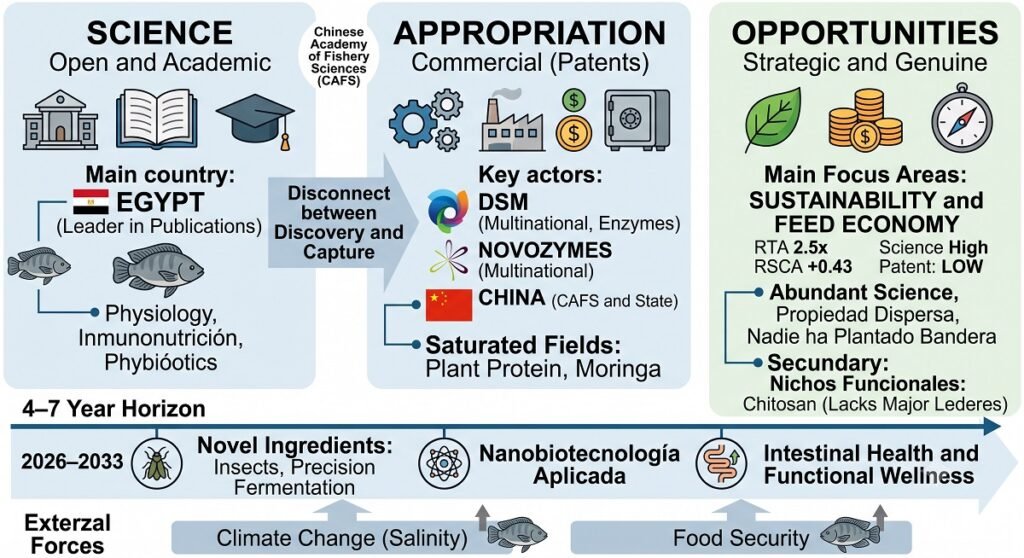
- Disconnect between science and intellectual property: While Egypt and various universities lead global scientific production in tilapia nutrition, intellectual property is dominated by enzyme multinationals (DSM, Novozymes) and China’s state and industrial ecosystem.
- The genuine opportunity gap: The least contested and most actionable alternative lies in the sustainability and feed economics axis. It accounts for nearly 20% of scientific research compared to less than 8% of patents, backed by a broad, rapidly growing body of knowledge without corporate giants dominating the segment.
- The weight of medicated feed: Nearly 40% of tilapia feed patents incorporate pharmaceutical classifications (A61K/A61P), reflecting a growing overlap between nutrition and therapeutics, particularly through traditional Chinese medicine phytogenics.
- 4–7 year technological frontier: Sector innovation is shifting toward protein replacement via insect meal (black soldier fly) and precision fermentation, nanobiotechnology applied to nutrition, and a paradigm change: prioritizing gut and metabolic health over simple muscle growth.
Imagine a formulator at a small feed mill in a tilapia-producing nation. For months, they have been evaluating Moringa—the so-called “miracle tree”—rich in protein, cost-effective, adaptable to diverse soils, and backed by dozens of trials confirming improved growth and immunity in the species. Eager to launch a functional feed that sets their brand apart from the conventional market, they prepare to invest in R&D.
What this formulator does not realize is that while the scientific community was publishing promising findings on Moringa, other players were securing their intellectual property rights through patents. The vast majority of these filings belong to Chinese entities.
This phenomenon lies at the heart of AquaHoy‘s prospective study on Nile tilapia (Oreochromis niloticus) nutrition, in which we analyzed over a decade of scientific output (2015–2027) against the global patent landscape (2015–2026). Beyond identifying research trends, our goal was to address a strategic question for investors and innovators: where are the open spaces for innovation, and which niches are already claimed by patent holders? The findings reshape the sector’s opportunity map and prompt a fundamental rethink of industry assumptions.
Methodology: How was the study conducted?
The technological frontier study was structured around three core objectives: (1) mapping the state of the art and its primary actors, (2) identifying the technological frontier along with its white spaces (unexplored domains), and (3) determining the extent to which scientific knowledge translates—or fails to translate—into patents. To achieve this, scientific literature (2015–2027) was integrated with the global intellectual property landscape (2015–2026).
Data collection was executed through two specialized search pathways:
- Scientific pathway: Queries in Scopus (Elsevier) yielded 5,171 retrieved documents (2015–2027 period).
- Patent pathway: Queries in The Lens (Cambia) identified 439 records across 344 simple families (2015–2026 period).
Tools and Processing
VOSviewer 1.6.20 (van Eck & Waltman, 2010) was used to build and visualize bibliometric networks. The methodological analysis follows the RIPL guidelines for patent landscape reporting (Smith et al., 2018). Key bibliometric techniques included word co-occurrence analysis, bibliographic coupling, co-citation, and co-authorship, applying modularity-based community detection algorithms to define thematic and author clusters. The relative specialization index (RTA/RSCA) and its methodological foundations are detailed in the “Science and Patents Nexus” section.
Additionally, the generative artificial intelligence tools Claude (Opus 4.8; Anthropic, 2026) and Gemini (Flash 3.1; Google, 2026) were utilized as assistants during the analysis and drafting phases. The author personally conducted all searches and data exports from Scopus and Lens, developed the maps in VOSviewer, and validated all underlying data. Consequently, the author thoroughly reviewed, verified, and edited all content, assuming sole responsibility for the conclusions presented.
Key Players in Tilapia (Oreochromis niloticus) Nutrition Science
In this section of the article, we present an overview of the key players in Nile tilapia (Oreochromis niloticus) nutrition research. We identified the leading countries, institutions, and researchers in this field to pinpoint where scientific knowledge is generated and their primary areas of specialization.
Research Geography
Tilapia, a species of African origin, has been introduced across nearly all continents for aquaculture purposes. In this context, we mapped the geographical distribution of global scientific production. By cross-referencing institutional affiliations with keywords and titles from the analyzed corpus, clear regional specializations emerge:
Mantente siempre informado
Stay Informed
Únete a nuestras comunidades para recibir al instante las noticias, informes y análisis más importantes del sector acuícola.
Join our communities to get instant access to the most important news, reports, and analysis from the aquaculture industry.
- Egypt (1,350) and Saudi Arabia (368) — Nutritional Physiology, Oxidative Stress, and Immunonutrition: Focus on functional dietary additives (phytobiotics, essential oils, and extracts) to mitigate oxidative stress and regulate immune gene expression. Driver: Regional water scarcity, demanding formulations that enhance resilience at high stocking densities.
- China (956) — Genomics, Metabolism, and Molecular Physiology: Priority on genomic analysis, metabolic pathways, and macronutrient requirements. Driver: Growth optimization through biotechnology and fishmeal substitution.
- Brazil (782) and Mexico (144) — Practical Nutrition and Digestive Physiology: Oriented toward practical requirements, carcass yield, digestibility, and enzymatic profiles. Driver: Expansion of neotropical intensive aquaculture and cost reduction via local byproducts utilization.
- Thailand (348) and Malaysia (140) — Health and Pathological Immunology: Focus on Streptococcus agalactiae control, disease resistance, and immune response. Driver: Pathogen pressure inherent to intensive farming systems.
- Indonesia (300) — Water Quality and Semi-Intensive Systems: Emphasis on water quality management and Aeromonas hydrophila prevention. Driver: Prevalence of small-scale family and SME aquaculture.
- USA (258) and India (263) — Population Genetics and Basic Nutrition.
Over the past decade, Egypt set the pace for tilapia nutrition research. With 1,350 published articles—accounting for over a quarter of global output—institutions such as Zagazig University and Kafrelsheikh University lead the field. China (956 articles), Brazil (782), and Saudi Arabia (368) follow in descending order. The table below details the output of the top ten countries by scientific publications and their thematic specializations:
Table 01: Scientific publications count by country and thematic leadership.
| Country | Publications | % of Corpus | Thematic Leadership (Keywords) |
| Egypt | 1,350 | 26.1% | Immunity, gene expression, oxidative stress |
| China | 956 | 18.5% | Streptococcus agalactiae, lipid metabolism, oxidative stress |
| Brazil | 782 | 15.1% | Fish farming, hematology, oxidative stress |
| Saudi Arabia | 368 | 7.1% | Immunity, oxidative stress, gene expression |
| Thailand | 348 | 6.7% | Immune response, Streptococcus agalactiae, disease resistance |
| Indonesia | 300 | 5.8% | Water quality, biofloc, Aeromonas hydrophila |
| India | 263 | 5.1% | Histopathology, oxidative stress, probiotics |
| United States | 258 | 5.0% | Gene expression, oxidative stress, aquaponics |
| Mexico | 144 | 2.8% | Biofloc, productive performance |
| Malaysia | 140 | 2.7% | Streptococcus agalactiae, feed efficiency, immunity |
Leading Institutions in Tilapia Nutrition Research
The analysis of the institutional landscape reveals a clear hegemony of universities; however, state research agencies such as the Chinese Academy of Fishery Sciences (CAFS) hold a prominent strategic presence:
- Dominant Universities (immunonutrition and applied physiology): The majority of scientific output is led by Egyptian (Zagazig, Kafrelsheikh, Alexandria, Cairo, Mansoura, and Benha) and Latin American universities (UNESP, Brazil). These institutions approach tilapia research through applied physiology, immunology, and the evaluation of additives to optimize performance in intensive farming.
- State Agencies (strategic research and genomics): The Chinese Academy of Fishery Sciences (CAFS, with 124 documents) represents targeted public research, focusing on metabolic regulation, population genomics, and the GIFT breeding program.
Research Lines by Institutional Core
Beyond quantifying publication volume per academic entity, identifying their core areas of expertise is essential. In this context, the following profiles emerge:
- Zagazig (333) and Kafrelsheikh (278) [Egypt]: Immunonutrition, nanoparticle and phytochemical supplementation, cytokine gene expression modulation, and oxidative stress mitigation.
- UNESP (130) [Brazil]: Quantitative nutrition, continental ingredient digestibility, and digestive physiology in neotropical systems.
- CAFS (124) and East China Normal (120) [China]: Digestive physiology, lipid and protein metabolism, alternative ingredient evaluation, and genomic biotechnology.
- King Saud (124) [Saudi Arabia]: Antioxidant enzymes, hematological, and immune parameters under high temperature and salinity conditions.
The following table lists the top 15 academic institutions by scientific publication volume in tilapia nutrition, along with their leading thematic areas:
Table 02: Leading academic institutions in scientific publications and thematic leadership.
| Institution | Publications | % of Corpus | Thematic Leadership (Keywords) |
| Zagazig University | 333 | 6.4% | Immunity, gene expression, oxidative stress |
| Kafrelsheikh University | 278 | 5.4% | Immunity, gene expression, immune response |
| National Institute of Oceanography and Fisheries (NIOF) | 277 | 5.4% | Gene expression, oxidative stress, histopathology |
| Alexandria University | 195 | 3.8% | Immunity, gene expression, immune response |
| Cairo University | 170 | 3.3% | Oxidative stress, gene expression, histopathology |
| Mansoura University | 149 | 2.9% | Gene expression, immune response, oxidative stress |
| Universidade Estadual Paulista (UNESP) | 130 | 2.5% | Digestibility, apparent digestibility, amino acids |
| Benha University | 127 | 2.5% | Gene expression, oxidative stress, immunity |
| Chinese Academy of Fishery Sciences (CAFS) | 124 | 2.4% | GIFT, lipid metabolism, oxidative stress |
| King Saud University | 124 | 2.4% | Immunity, gene expression, oxidative stress |
| East China Normal University | 120 | 2.3% | Lipid metabolism, gut microbiota, flesh quality |
| Suez Canal University | 108 | 2.1% | Gene expression, oxidative stress, histopathology |
| Shanghai Ocean University | 105 | 2.0% | Immunity, biofloc technology, immune response |
| Chiang Mai University | 96 | 1.9% | Immune response, Streptococcus agalactiae, disease resistance |
| Al-Azhar University | 84 | 1.6% | Immunity, immune response, biofloc |
Leading Researchers in Nile Tilapia (Oreochromis niloticus) Nutrition
To complete the overview of scientific output, identifying the highest-impact researchers in tilapia nutrition is essential. Based on publication volume and citation count, the most prolific authors coalesce around three major schools of specialization:
- School of Immunonutrition, Additives, and Antioxidant Physiology (Egypt and European Partners):
- Dawood, Mahmoud A.O. (129 documents, 7,214 citations): Absolute leader in the field, focusing on functional dietary additives, enzymatic activity, oxidative stress mitigation, and non-specific immune response.
- Ibrahim, Rowida E. (68 documents): Specialized in the interplay among nutrition, immune gene expression, and antioxidant capacity.
- Abdel-Tawwab, Mohsen (56) & Younis, Elsayed M. (56): Key figures in evaluating hematological parameters, productive performance, and diets supplemented with natural antioxidants.
- Davies, Simon J. (60, UK): European benchmark in the development and evaluation of plant-based protein substitutes.
- Other key authors: Hassaan, Mohamed S. (50); Khamis, Tarek (49); Abdel Rahman, Afaf N. (48).
- School of Prophylaxis, Microbiome, and Pathological Immunology (Thailand):
- Van Doan, Hien (79 documents, 3,735 citations): Focused on preventing bacterial infections (emphasizing Streptococcus agalactiae), modulating gut microbiota via synbiotics, and enhancing immune responses for disease resistance.
- School of Molecular Physiology, Genomics, and Lipid/Hepatic Metabolism (China):
- Wen, Hua (52) & Xu, Pao (51) [CAFS]: Leading studies on growth regulation in the GIFT strain and quantitative nutrient requirements.
- Du, Zhen-Yu (73) & Zhang, Mei-Ling (64) [East China Normal]: Research focused on lipid metabolism, fillet quality, and hepatic health.
- Chen, Li-Qiao (59) & Qiao, Fang (54): Specialists in gut microbiota regulation and energy metabolism.
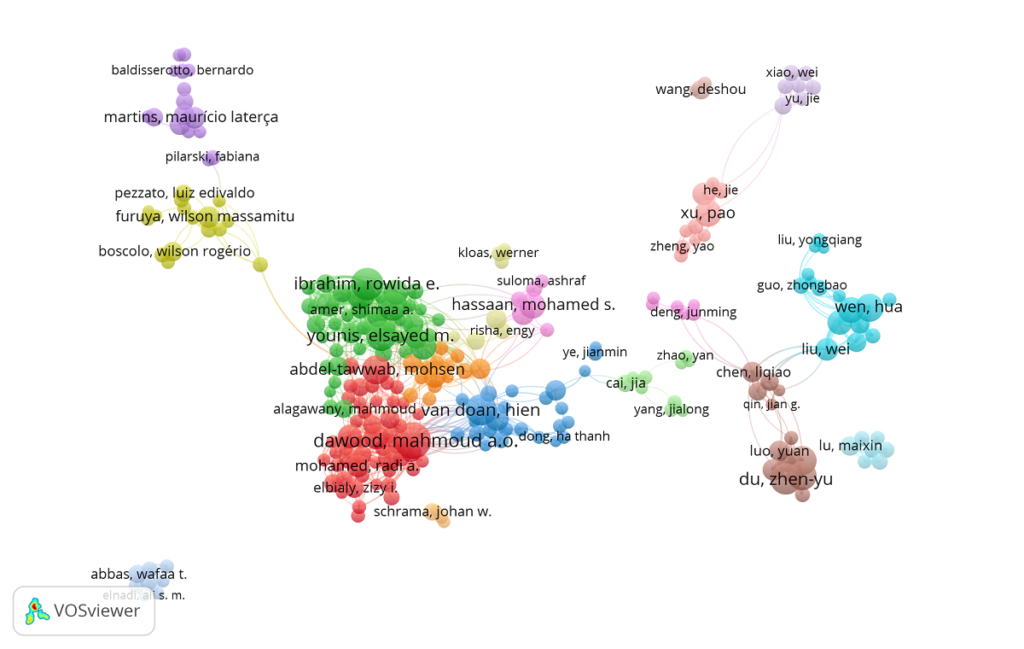
Researchers do not work in isolation; beyond collaborating within their respective academic research groups, they establish international networks. Co-authorship analysis of 1,099 authors (with documents) revealed a connected network of 979 researchers and 6,251 links, structured via community detection (modularity) into 36 clusters. International collaboration accounts for 31% of total publications ( countries).
The network structure in Figure 1 reveals an archipelago of national schools rather than an integrated global community:
- Egyptian Core (Open and International): Dominated by dense, contiguous Egyptian communities that concentrate the highest volume. Notable networks include Dawood’s (128 authors, integrating Van Doan and Thailand, serving as a bridge between Egypt and Southeast Asia), Ibrahim–Younis–Davies’s (126 authors, linked with Saudi Arabia and European partner Davies), Hassaan–El-Haroun’s (focused on protein substitution), and Abdel-Tawwab–Alagawany’s. It represents the block with the highest international connectivity.
- Brazilian Clusters (National and Independent): Brazil forms three distinct communities with minimal connection to the Egyptian core: nutrition and digestibility (Furuya, Boscolo, Pezzato), health and probiotics (Martins, Mouriño, Owatari), and Latin American biofloc (Emerenciano, Baldisserotto). Their collaboration occurs almost exclusively at the domestic level.
- Chinese Clusters (National and Independent): The East China Normal groups (Du Zhen-Yu, Zhang, Chen, Qiao), focused on lipid metabolism, and CAFS groups (Wen Hua, Xu Pao), dedicated to the GIFT strain, operate as closed communities between Chinese universities and public agencies, with weak external ties.
Thematic Knowledge Map of Tilapia Nutrition
Thematic State of the Art
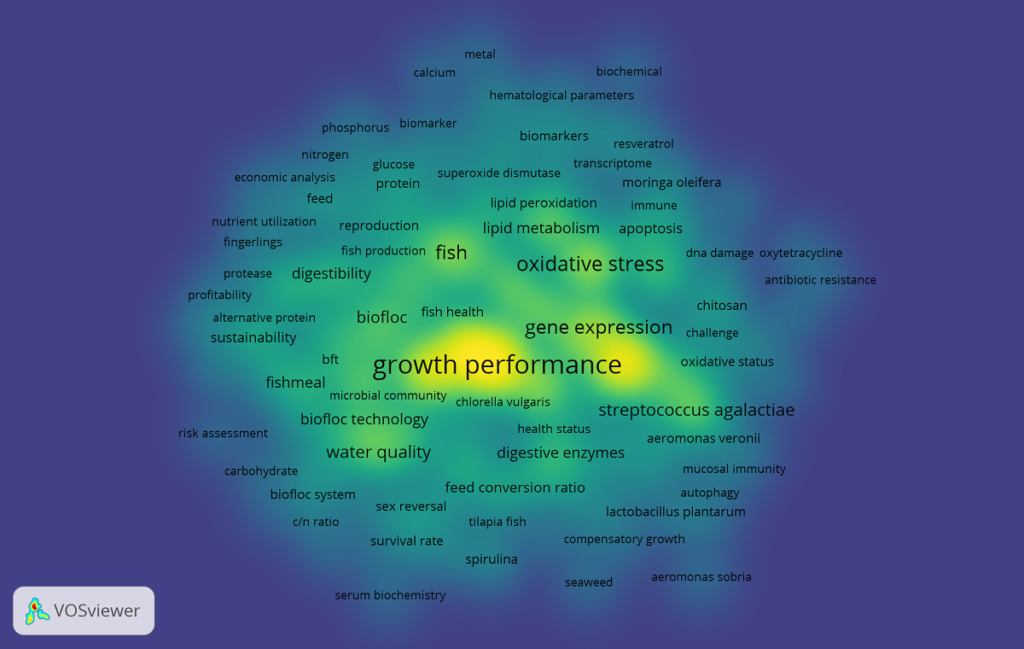
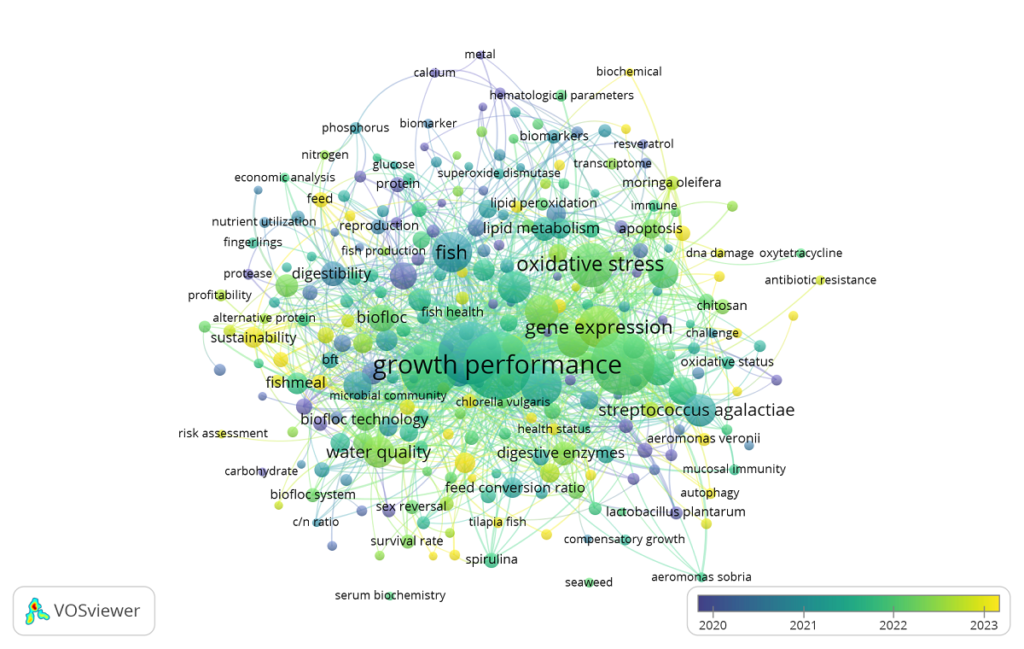
The co-occurrence network (277 terms with occurrences and 4,591 links) organizes into four macro-clusters via community detection (resolved by VOSviewer into 9 finer sub-clusters, visible in Figure 2). All share a very close mean publication year (2021.3–2021.8), pointing to a research field that accelerated as a cohesive block; subtle recency differences can be observed in the overlay visualization map (Figure 3). Ordered by their total occurrence weight:
Table 3. Thematic clusters in scientific publications on Nile tilapia nutrition.
| Cluster | Terms | Occurrences | Mean Year | Thematic Front |
| A | 67 | 4,105 | 2021.7 | Immunonutrition, health, and growth performance |
| B | 72 | 3,494 | 2021.3 | Nutrition, alternative ingredients, and metabolism |
| C | 83 | 2,527 | 2021.8 | Culture systems, biofloc, and sustainability |
| D | 55 | 1,499 | 2021.5 | Stress physiology and nutrigenomics |
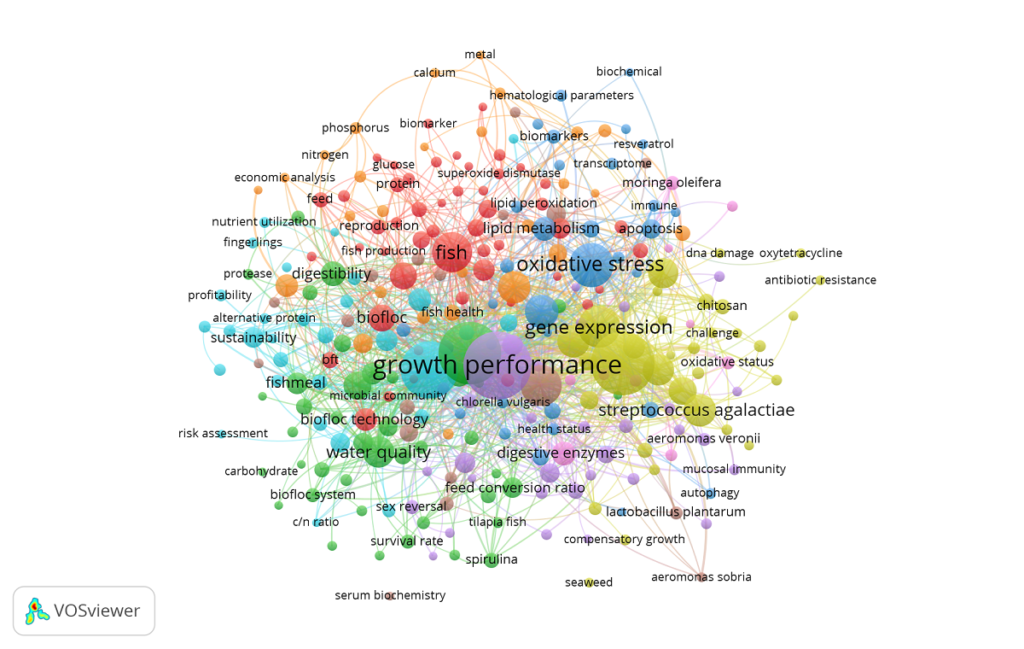
- Cluster A — Immunonutrition, Health, and Growth Performance (Largest Relative Weight): Dominant terms: growth performance (513), immunity (452), gene expression (195), probiotics (189), Streptococcus agalactiae (117), Aeromonas hydrophila (109), disease resistance (90), digestive enzymes (63), and antioxidants (53). This forms the core of the field, linking growth performance to pathogen defense via functional additives (probiotics and immunostimulants). The co-occurrence of immunity, pathogens, and growth within the same cluster confirms that nutrition and health are inseparable in tilapia: aquafeed is formulated both to maximize biomass and protect the host.
- Cluster B — Nutrition, Alternative Ingredients, and Metabolism: Dominant terms: growth (430), gut microbiota (127), antioxidant (100), digestibility (69), lipid metabolism (64), fishmeal (52), feed conversion ratio (47), feed efficiency (38), and soybean meal (36). It represents the traditional nutritional-metabolic core: feed conversion efficiency, digestibility, fishmeal substitution with plant ingredients (soybean), and the modulation of both microbiome and lipid metabolism. This links the quantitative nutritional requirement agenda with the molecular aspect of metabolism.
- Cluster C — Culture Systems, Biofloc, and Sustainability (Most Recent Front, 2021.8): Dominant terms: aquaculture (361), water quality (110), biofloc (85), biofloc technology (59), aquaponics (58), feed additive (50), sustainable aquaculture (49), sustainability (47), and alternative protein. Reflects the ecological-industrial dimension: coupling nutrition with the culture environment (biofloc systems, aquaponics) within a sustainability framework. It is currently the fastest-accelerating front, aligning with cross-analysis findings where sustainability stands out as an open opportunity gap.
- Cluster D — Stress Physiology, Antioxidant Response, and Nutrigenomics: Dominant terms: oxidative stress (222), histopathology (120), hematology (118), antioxidant enzymes (47), liver (46), apoptosis (43), salinity (35), and inflammation (29). Corresponds to the cellular response front: evaluating how fish respond—at the level of oxidative stress, liver tissue, hematology, and defense gene expression—to diet and environmental conditions. After filtering out non-relevant ecotoxicology elements, this group is interpreted through a nutrigenomics lens (direct dietary impact on physiological state).
Emerging Trends and the Future of the Field
Beyond analyzing the current state of research, anticipating the future trajectory of Nile tilapia (Oreochromis niloticus) nutrition is essential. In this context, overlay visualization analysis (2020–2023+) identifies the sector’s recent evolution.
By quantifying term recency—calculated via the mean publication year and the percentage of occurrences from 2023 onward—against an overall corpus baseline year of 2021.6, the body of knowledge structures into three evolutionary layers (Figure 4):
- Emerging Frontiers (Mean Year ): Expanding fronts grouped by thematic affinity:
- Sustainability and Sustainable Aquafeed (Highest Volume Current): Sustainable aquaculture (year 2023.6; 69% in 2023+), sustainability (2022.9; 59%), aquafeed (2023.2), and fishmeal replacement (2022.8), representing the strategic link between nutrition and sustainability.
- Novel Protein Ingredients and Fermentation: Black soldier fly (2023.1; 53% in 2023+) and fermentation (2022.8; 62%), highlighting insect meal and precision fermentation as emerging fishmeal substitutes.
- Applied Nanobiotechnology: Nanoparticles (2023.0; 72% in 2023+, the highest momentum in the corpus), showcasing nanometric delivery vehicles for additives and nutrients as a rapidly growing front.
- Gut Health and Physiological Status: Gut health (2023.3; 58%), health status (2023.2), and biochemical parameters (2023.0), reflecting a shift from measuring muscle growth alone to evaluating digestive functionality and well-being.
- Novel Pathogens and External Drivers: Aeromonas veronii (2023.4)—evidencing expansion beyond classic Streptococcus—salinity stress (2024.6; 93% in 2023+), and food safety (2023.1), responding to climate change pressures and market demands.
- Mature Topics (Mean Year ~2021–2022): Form the consolidated core of the corpus: growth performance, feed conversion ratio, immunity, gene expression, oxidative stress, probiotics, and Streptococcus agalactiae.
- Established Topics or Low Relative Novelty (Mean Year ): Display lower recent dynamism: amino acids (2019.6), prebiotic (2019.3), non-specific immunity (2019.4), curcumin (2019.9), GIFT strain (2019.9), polyculture (2019.9), hybrid tilapia (2019.4), intestinal morphology (2020.0), and protein (2020.0).
Field Trajectory
Tilapia nutrition is undergoing a clear shift from basic nutritional requirements toward sustainability, novel ingredients, nanobiotechnology, and functional health. This directly aligns with the patent landscape, indicating that the sector’s future will be contested in sustainability and functional ingredients rather than conventional raw materials.
Technological Appropriation: Who Files Patents?
We identified 439 patent documents (2015–2026 period) related to tilapia (Oreochromis niloticus) nutrition, corresponding to 344 simple patent families following deduplication. The temporal distribution and CPC code classifications are presented at the document level, whereas applicant evaluation is conducted at the family level using thesaurus-consolidated data.
Temporal Evolution of Patent Documents
The patent landscape in tilapia nutrition shows a strong expansion between 2018 and 2021—peaking historically in 2018 with 65 filings—followed by a stabilization phase during 2022–2023 and a sustained rebound starting in 2024. The 17 filings recorded in 2026 (current year) confirm a maturing sector with continuous renewal, driven primarily by functional nutrition, enzyme development, and sustainable biotechnology.
Table 04. Number of published patents per year (2015–2026).
| Year | Published Patents |
| 2015 | 17 |
| 2016 | 8 |
| 2017 | 22 |
| 2018 | 65 |
| 2019 | 60 |
| 2020 | 61 |
| 2021 | 53 |
| 2022 | 37 |
| 2023 | 24 |
| 2024 | 35 |
| 2025 | 40 |
| 2026 | 17 |
Major Patent Applicants (Family Level)
The following table presents the top patent applicants related to tilapia (Oreochromis niloticus) nutrition at the family level, alongside their core technological focus. In this landscape, the multinational DSM leads the sector with 28 patent families (8.1% of the total), directing its IP strategy toward functional additives, enzymes, lipids/fatty acids, and digestive health solutions.
Table 05. Major companies/institutions applying for patents related to tilapia nutrition.
| Applicant | Families | % (of 344) | Technological Focus |
| DSM | 28 | 8.1% | Functional additives, enzymes, lipids/fatty acids, digestive health |
| Chinese Academy of Fishery Sciences (CAFS) | 21 | 6.1% | Local immunomodulators, applied herbal medicine, resistance diets |
| Novozymes | 17 | 4.9% | Enzymes (phytases, proteases, carbohydrases), probiotics |
| Guangxi University | 7 | 2.0% | Health/immunity, lipids, plant protein |
| Nutreco | 6 | 1.7% | Functional additives, plant protein, amino acids/vitamins |
| Guangxi Academy of Fishery Sciences | 6 | 1.7% | Immunity, additives, probiotics |
| South China Agricultural University | 6 | 1.7% | Plant protein, lipids |
| Guangxi Nanning Wuming Mingshanhong Agric. Tech. | 6 | 1.7% | Botanicals/phytogenics, additives |
| Sun Yat-Sen University | 5 | 1.5% | Functional additives, lipids, immunity |
| Midori USA Inc | 4 | 1.2% | Probiotics, additives |
Technological Focus (Most Frequent CPC Codes at Document Level)
The distribution of the most frequent Cooperative Patent Classification (CPC) codes is presented below, expressed as the percentage of documents (out of a total of 439) incorporating each category (a single document may include multiple codes):
Table 06. Distribution of the most frequent CPC codes in the selected patents.
| CPC Code | % of Documents | Technical Meaning |
| A23K 50/80 | 86.6% | Feeds for aquatic animals (core code) |
| A23K 10/30 | 52.8% | Feeds of plant origin (fishmeal replacement) |
| Y02A 40/818 | 49.7% | Climate change mitigation in aquaculture (“green” tag) |
| A23K 20/158 | 32.1% | Fatty acid, fat, and oil additives |
| A23K 10/37 | 31.9% | Feeds derived from plant protein byproducts |
| A23K 20/174 | 28.2% | Organic compound additives |
| A23K 10/22 | 28.0% | Feeds derived from seeds and vegetables |
| A23K 20/147 | 27.6% | Protein, peptide, and enzyme additives |
| A23K 20/163 | 25.5% | Carbohydrate additives |
| A23K 20/105 | 22.3% | Mineral additives (phosphorus) |
| A23K 10/18 | 20.5% | Feeds formulated with microorganisms (probiotics) |
| A23K 40/10–30 | ~30% | Feed processing and shaping (pelleting) |
The Three Technological Pillars
Grouping information by patent subclass families structures the market into three core axes:
- Fishmeal replacement with plant inputs (Family A23K 10/, present in 75.6% of documents): Forms the dominant pillar. It encompasses plant ingredients (10/30), protein byproducts (10/37), and seed derivatives (10/22). This classification confirms in the patent domain what quantitative analysis identified: plant substitution represents a mature, consolidated space.
- Functional additives (Family A23K 20/, 79.3%): Encompasses all accessory food factors: fatty acids (20/158), proteins and enzymes (20/147), carbohydrates (20/163), minerals (20/105), and amino acids. It represents the direct wing of “precision nutrition.”
- Sustainability label (Families Y02A / Y02P, ~60%): Nearly two-thirds of documents carry environmental mitigation classifications (Y02A 40/818 for aquaculture and Y02P 60/87 for animal production). This demonstrates that sustainability transcends academic discourse and is formally coded into most inventions.
A Key Finding: The Relevance of Medicated and Therapeutic Feed
A prominent finding lies in the high proportion of formulations with pharmaceutical claims: 38.5% of documents carry the A61K classification (medicinal preparations), and 24.8% carry A61P (therapeutic activity). That is, a considerable proportion of patents assigned to tilapia feeding corresponds to functional feeds for therapeutic purposes—immunostimulants and, particularly, formulas based on traditional Chinese medicine applied to compound feed. This overlap between nutrition and pharmacology is a distinguishing feature of China’s patent ecosystem and explains the massive capture of phytogenic ingredients.
- Probiotics (A23K 10/18): Increased from 16.9% to 25.5%, confirming a clear upward trend in the use of microorganisms in patents.
- Plant ingredients (A23K 10/30): Slight variation from 52.9% to 50.3%, remaining a mature, stable pillar.
- Enzymes and proteins (A23K 20/147): Decreased from 26.2% to 21.6%.
- Climate tag (Y02A 40/818): Dropped from 58.1% to 30.7%. This figure should be interpreted with caution, as it may reflect changes in patent office classification practices rather than an actual abandonment of the environmental agenda.
Technological Focus by Applicant (Code Level)
- DSM (A23K 20/189 and 20/xx): Its additive patents are distributed across multiple species (A23K 50/80 for aquatic organisms, 50/75, and 50/30), integrating tilapia into global animal nutrition portfolios.
- Novozymes (C12Y 302 and A61K 38/47): Shows a clear footprint in glycosidase, phytase, and therapeutic enzyme classifications, confirming its specialization in enzymatic biotechnology.
- CAFS (A23K 50/80, Y02A 40/818, and A23K 10/30): Focuses on plant inputs with sustainable certification, aligning with Chinese state research policies.
Final Diagnosis
Patented technology in tilapia nutrition rests on three pillars—plant substitution, functional additives, and environmental sustainability—with a notable influence of Chinese-origin medicated feeds. Specialization among major players is well defined: DSM leads in multi-species additives, Novozymes in enzymatic biotechnology, and CAFS in integrating plant protein with a sustainability seal. The only stream showing a clear expansive dynamic into the future is probiotics.
Cross-Analysis of Science and Patents
The cross-analysis quantifies the weight of each thematic area within both the academic realm (% of 5,171 documents) and the intellectual property domain (% of 344 patent families). To achieve this, the Revealed Technology Advantage index (RTA) is used—an adaptation of Balassa’s (1965) classic Revealed Comparative Advantage index applied to the patent domain (Soete, 1987; Patel & Pavitt, 1997) and scientometrics (Frame, 1977; Mansourzadeh et al., 2019):
An RTA > 1 value indicates a topic with greater presence in scientific production than in patent filings (academic research precedes commercial appropriation), whereas an RTA < 1 reflects the opposite (industry leads development).
To correct the inherent asymmetry of the ratio—which compresses between 0 and 1 below neutrality but expands indefinitely from 1 to above it—its symmetric version is also calculated: the Revealed Symmetric Comparative Advantage (RSCA), developed by Dalum, Laursen, and Villumsen (1998):
This index is bounded within the range [-1, +1]. An RSCA > 0 value indicates that science leads the front (the existence of an opportunity gap); an RSCA < 0 points to a domain dominated by patents (territory appropriated by industry); and an represents equilibrium. As demonstrated by Laursen (2015), RSCA is preferable to raw RTA due to its superior statistical properties, offering a symmetric distribution around zero.
Table 07 presents the technological fronts along with a strategic diagnosis for each front based on their RTA and RSCA indices.
Table 07. Technological fronts, RTA and RSCA indices, and strategic diagnosis.
| Topic / Technological Front | Science % | Patents % | RTA | RSCA | Strategic Diagnosis |
| Biofloc | 7.1% | 0.9% | 8.12 | +0.78 | Strong scientific bias (focus on technique, not product) |
| Enzymes (phytase/protease) | 27.6% | 8.4% | 3.27 | +0.53 | Highly studied; scarce patents, highly concentrated in DSM/Novozymes |
| Sustainability / Feed Economics | 19.9% | 7.8% | 2.53 | +0.43 | 🟢 Genuine opportunity gap (open space) |
| Probiotics | 11.9% | 9.6% | 1.24 | +0.11 | Balanced development between science and patents |
| Chitosan | 1.5% | 1.5% | 1.05 | +0.02 | Small, balanced niche |
| Algae / Seaweed | 5.7% | 6.1% | 0.94 | −0.03 | Balanced development |
| Moringa / Phytogenics | 6.0% | 11.6% | 0.52 | −0.32 | 🔴 More patented than published; industry is ahead |
| Plant Protein / Fishmeal Replacement | 12.6% | 30.2% | 0.42 | −0.41 | 🔴 Saturated and heavily appropriated territory |
Methodological Note: Term-matching overlap provides a directional signal and should not be interpreted as an absolute count. Shares are calculated based on thematic prevalence (% of documents addressing the term) and do not sum to 100% because a single publication may encompass multiple categories. Unlike classic Balassa RCA—designed for mutually exclusive categories—this study uses an Activity Index formulation (Frame, 1977) suitable for overlapping topics. For smaller corpora (such as chitosan or biofloc), the index shows higher sensitivity to variations in a small number of documents.
Areas with Industry Leadership Exceeding Scientific Production (RTA < 1)
The two fronts with the lowest Revealed Technology Advantage values prove to be the most revealing, as they invert common intuition: they are patented in a higher proportion than they are published in scientific literature.
- Plant Protein and Fishmeal Replacement (): Accounts for 30% of patents compared to just 13% of scientific articles, forming a consolidated commercial battlefield where substituting fishmeal with plant and microbial inputs dominates the IP portfolios of DSM, Novozymes, and several Chinese universities—meaning innovation here faces a heavily appropriated market.
- Moringa and Phytogenic Additives (): Represents a conditional opportunity where, despite appearing as a promising white space in bibliometric maps, cross-analysis shows 40 patent families (11.6% of the total) already claim its use—nearly doubling its academic representation. A closer look at rights holders yields a striking diagnosis: 35 of those 40 families originate from China, led by the Chinese Academy of Fishery Sciences (CAFS, 6 filings) and local feed companies (Foshan Shunde Wanghai, Pujiang Youze, Guangdong Ocean), whereas global multinationals like DSM hold a marginal presence (2 filings). This is not a generic advance by global industry, but rather China’s state and industrial ecosystem capturing phytogenic technology while Egyptian academia publishes the foundational research; thus, investing in Moringa based solely on scientific literature means navigating a dense thicket of Chinese patents.
Science vs. Patent Disconnects (RTA > 1): Real Opportunities vs. Misleading Gaps
A high RTA index alone does not guarantee a commercial opportunity; understanding why a topic is underrepresented in patents is essential:
- Biofloc Systems ( — The Largest, Yet Misleading Disconnect): Accounts for high scientific volume (7.1%) against virtually no patent presence (3 families). This stems not from market disinterest, but because biofloc is an operational management technique inherently difficult to patent as a commercial product—making the 3 existing filings by DSM, Novozymes, and Tongwei mere testimonial records rather than an IP-exploitable product gap.
- Enzymes (): Represents the most studied topic in the academic corpus (27.6%), yet accounts for only 8.4% of patents. However, these filings are heavily concentrated under two multinationals, DSM and Novozymes, creating an IP oligopoly on widely researched academic territory that imposes high entry barriers despite low total family counts.
- Sustainability and Feed Economics ( — The Genuine Opportunity Gap): Represents 19.9% of scientific output versus 7.8% of patents, without a dominant player monopolizing the market. Unlike biofloc, this category is fully patentable; unlike enzymes, it is not controlled by corporate giants—making it the most actionable disconnect by pairing broad, expanding academic backing with moderate, fragmented commercial appropriation.
- Chitosan (; ): Holds a 1.5% share in both science and patents, marking an equilibrium point rather than an innovation gap. While a small-scale niche on both fronts, it stands out as an opportunity due to the absence of global leaders: all 5 registered families belong to small Chinese feed companies (Hainan Gesong, Guangxi, and Guangzhou Guanxing) without presence from giants like DSM or Novozymes.
Synthesis of Analysis: Appropriation Dynamics and Strategic Opportunities
The global patent ranking highlights a clear gap: no Egyptian university appears among the top rights holders. Market leadership belongs to other players: multinational DSM leads with 28 patent families, followed by the Chinese Academy of Fishery Sciences (CAFS) with 21, and Novozymes with 17. Simply put, academia generates knowledge, while enzyme/ingredient multinationals and the Chinese state apparatus secure the intellectual property—revealing a structural disconnect between who produces science and who capitalizes on its commercial value.
Where is the True Innovation Opportunity Concentrated?
Setting aside saturated or restrictive niches, the study points to a single, highly actionable domain: sustainability and feed economics. This front displays a Revealed Technology Advantage of —accounting for nearly 20% of scientific output versus under 8% of patents. Unlike biofloc, it is a patentable technology; and unlike enzymes, it is not dominated by a corporate duopoly. It represents a broad, rapidly expanding body of knowledge with moderate, fragmented commercial appropriation where no multinational has yet established dominance.
The least contested opportunity lies neither in heavily promoted ingredients (such as Moringa: RSCA = -0.32, dominated by China), non-patentable management techniques (biofloc: RSCA = +0.78, lacking a commercial product), nor oligopolistic sectors (enzymes: RSCA = +0.53, concentrated in DSM and Novozymes). The real potential lies in the sustainability and economic feed efficiency axis (RSCA = +0.43)—a genuine strategic niche with abundant science and scattered patents—and, secondarily, in specific functional ingredients where major players are absent, whereas the rest of the technology map is either saturated (such as plant protein substitution: RSCA = -0.41) or controlled by specific firms.
Secondarily, smaller functional niches emerge where multinationals have no established presence. Chitosan—a crustacean exoskeleton-derived biopolymer used as a functional additive—illustrates this scenario: it maintains a balance between science and patents without DSM or Novozymes involvement, representing a small but strategically open market.
Finally, the analysis uncovers a critical finding: nearly 40% of patents classified under “tilapia feed” carry pharmaceutical classifications. A substantial proportion corresponds to therapeutic claims—immunostimulants and, notably, traditional Chinese medicine applied to diets. The line between feed and drug is blurring, and this overlap serves as the primary gateway through which China’s biotechnological ecosystem has captured intellectual property over phytogenic inputs such as Moringa.
Conclusions
Implications for Technology Intelligence and Competitive Intelligence: The narrative of Nile tilapia (Oreochromis niloticus) nutrition reflects an open, predominantly academic science—led by Egypt—that does not control its own commercial appropriation, which has been captured by enzyme multinationals (DSM, Novozymes) and, within botanical ingredients, by China’s state and industrial ecosystem (CAFS and local firms). The least contested innovation lies in the sustainability and feed economics axis—a strategic niche with abundant science and still-scattered patents—and, secondarily, in specific functional ingredients where corporate giants are absent (such as chitosan). In contrast, ingredients heavily promoted in academic literature (such as Moringa) represent territory where Chinese industry has already consolidated its intellectual property, establishing a coherent 4–7 year strategic horizon.
The study tracked the evolution of the technological frontier by identifying the fastest-growing topics in recent years, with the 2026–2033 outlook projecting a profound transformation in sector focus:
- Novel protein replacement sources: Insect meal (particularly black soldier fly) and precision fermentation processes emerge as technological replacements for fishmeal.
- Nanobiotechnology applied to aquaculture: Developing nanometric delivery vehicles to precisely target nutrients and functional additives constitutes the fastest-accelerating front across the entire corpus.
- Shift from production to functional health: Research is migrating from traditional muscle growth indicators to comprehensive health evaluation, with gut health and digestive well-being displacing final weight as the sole metric.
Additionally, two decisive external drivers are at play: climate change—introducing salinity stress to previously unexposed farming systems—and food safety requirements in global markets, while the emergence of pathogens like Aeromonas veronii demonstrates that the health agenda extends beyond classic Streptococcus.
If an aquafeed formulator seeks to compete in space with genuine development opportunities, the prospective map indicates a clear path: formulations conceived around feed sustainability and economic efficiency, functional niches neglected by multinationals (such as chitosan), or near-future technologies (insects, fermentation, and gut health) before they face the patent saturation currently seen in Moringa. Science in tilapia nutrition is abundant and accessible; strategic opportunity, however, resides in those spaces that have not yet been appropriated.
Frequently Asked Questions (FAQ)
Who leads scientific production and patenting in tilapia nutrition?
There is a disconnect between knowledge generation and its commercial appropriation:
– Scientific production: Broadly led by Egyptian universities (such as Zagazig and Kafrelsheikh), which account for over 26% of global articles, followed by institutions in China and Brazil.
– Intellectual property (patents): Dominated by additive and enzyme multinationals such as DSM and Novozymes, alongside China’s state and industrial apparatus (led by the Chinese Academy of Fishery Sciences, CAFS).
Is Moringa a good investment opportunity for functional tilapia feeds?
Although scientific literature broadly highlights the immunological and nutritional properties of Moringa, patent analysis reveals it is a heavily appropriated niche. Indeed, 11.6% of global tilapia nutrition patents already claim the use of Moringa, with 87.5% of these patent families belonging to Chinese entities; thus, investing in this input means navigating a dense intellectual property thicket.
Where are the best uncontested innovation opportunities in tilapia nutrition located?
The most actionable opportunity with the lowest corporate giant presence is concentrated in the sustainability and feed economics axis. This front accounts for nearly 20% of scientific production but less than 8% of global patents, combining broad academic backing with a commercial appropriation that remains scattered and devoid of absolute leaders.
What are the main technological trends in Nile tilapia nutrition for the next 4 to 7 years?
Technological advancement in tilapia nutrition is shifting toward four strategic fronts:
– Novel protein sources: Insect meal (such as black soldier fly) and products derived from precision fermentation.
– Nanobiotechnology: Nanometric delivery vehicles for targeted nutrient and additive administration.
– Gut health and well-being: Transitioning from traditional muscle growth metrics toward metabolic and digestive health.
– External drivers: Salinity stress mitigation driven by climate change and the control of emerging pathogens such as Aeromonas veronii.
References
Balassa, B. (1965). Trade liberalisation and ‘revealed’ comparative advantage. The Manchester School, 33(2), 99–123. https://doi.org/10.1111/j.1467-9957.1965.tb00050.x
Dalum, B., Laursen, K., & Villumsen, G. (1998). Structural change in OECD export specialisation patterns: De-specialisation and ‘stickiness’. International Review of Applied Economics, 12(3), 447–467. https://doi.org/10.1080/02692179800000017
Laursen, K. (2015). Revealed comparative advantage and the alternatives as measures of international specialisation. Eurasian Business Review, 5(1), 99–115. https://doi.org/10.1007/s40821-015-0017-1
Smith, J. A., Arshad, Z., Trippe, A., Collins, G. S., Brindley, D. A., & Carr, A. J. (2018). The Reporting Items for Patent Landscapes statement. Nature Biotechnology, 36(11), 1043–1047. https://doi.org/10.1038/nbt.4291
van Eck, N. J., & Waltman, L. (2010). Software survey: VOSviewer, a computer program for bibliometric mapping. Scientometrics, 84(2), 523–538. https://doi.org/10.1007/s11192-009-0146-3

Editor at the digital magazine AquaHoy. He holds a degree in Aquaculture Biology from the National University of Santa (UNS) and a Master’s degree in Science and Innovation Management from the Polytechnic University of Valencia, with postgraduate diplomas in Business Innovation and Innovation Management. He possesses extensive experience in the aquaculture and fisheries sector, having led the Fisheries Innovation Unit of the National Program for Innovation in Fisheries and Aquaculture (PNIPA). He has served as a senior consultant in technology watch, an innovation project formulator and advisor, and a lecturer at UNS. He is a member of the Peruvian College of Biologists and was recognized by the World Aquaculture Society (WAS) in 2016 for his contribution to aquaculture.