- 1 Key Takeaways
- 2 What does it mean for fish demand to be “price-sensitive”?
- 3 Five Years of Data Across More Than 67,000 Supermarkets
- 4 Salmon: The Product with Pricing Power in the U.S. Market
- 5 Trout, Catfish, and Pangasius: When Every Cent Determines the Purchase
- 6 Catfish: No Obvious Substitutes… Until Purchasing Power Is Factored In
- 7 Trade Promotions Reveal an Uneven Impact
- 8 Strategic Implications for U.S. Fillet Marketers
- 9 Methodological Scope and Study Limitations
- 10 Conclusion: Strategic Lessons from the Mississippi Delta
- 11 Editor’s Note
- 12 Entradas relacionadas:
Key Takeaways
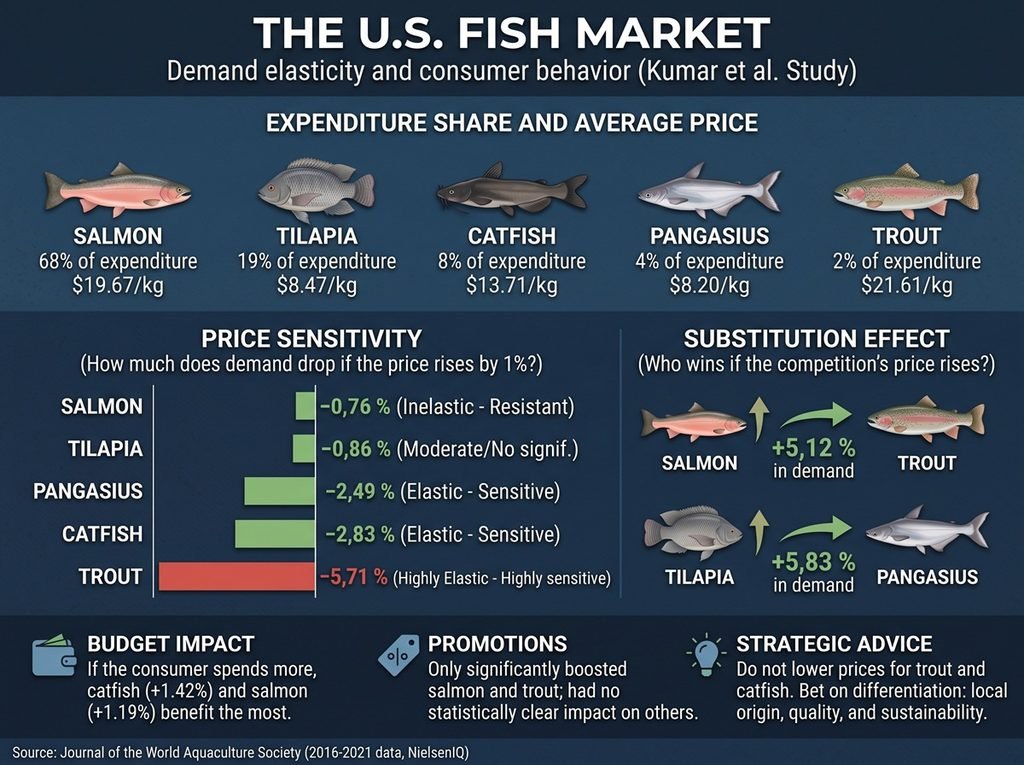
- With a 1% price increase, salmon demand drops by merely 0.76%; the consumer absorbs the cost.
- A 1% increase in the price of trout reduces sales by 5.71%. Catfish and pangasius likewise exhibit pronounced sensitivity: −2.83% and −2.49%, respectively.
- If tilapia prices rise by 1%, pangasius demand rebounds by 5.83%; meanwhile, trout climbs by 5.12% when salmon becomes more expensive.
- In-store discounts drove sales gains only for salmon and trout; for tilapia, pangasius, and catfish, they displayed no statistical significance.
- When consumers expand their overall seafood expenditures, catfish and salmon emerge as the primary beneficiaries, whereas tilapia barely capitalizes on the increase.
It is Tuesday morning at a Mississippi Delta processing plant, and the Chief Financial Officer is reviewing the cost structure for the umpteenth time. Feed, energy, and labor continue their upward climb. The equation is as straightforward as it is uncomfortable: to preserve operating margins, frozen catfish fillets would need to rise by a few cents on retail supermarket shelves.
Yet, just a few feet away in the very same display freezer lies a bag of imported pangasius fillets priced at levels unattainable for domestic aquaculture. A bit further along sits salmon, commanding twice the price of the rest while consistently sustaining rapid inventory turnover. Faced with this landscape, the dilemma for any fish farmer is immediate: if I adjust prices upward, how many customers will I lose?
A research study published in the Journal of the World Aquaculture Society precisely quantifies this dynamic. Ganesh Kumar (Thad Cochran National Warmwater Aquaculture Center, Mississippi State University), Carole Engle (Engle-Stone Aquatic LLC), and Lianqun Sun (Tennessee Tech University) examined five years of U.S. supermarket scanner data to evaluate the price elasticity of five farmed species: salmon, tilapia, pangasius (swai/basa/tra), catfish, and trout.
The study outlines a strategic roadmap of direct in-freezer competition, identifying which species command pricing power and which surrender market share at the slightest price adjustment. For any company marketing frozen fillets in the world’s leading import destination—including Latin American exporters of trout, tilapia, or salmon—these findings serve as an essential commercial roadmap.
What does it mean for fish demand to be “price-sensitive”?
In economics, this phenomenon is defined as price elasticity of demand: the percentage change in quantity purchased when the price fluctuates by 1%. If sales decline by a proportion greater than that 1%, demand is considered elastic; if the contraction is smaller, it is classified as inelastic.
A vivid analogy clarifies this dynamic: inelastic demand operates like a deep reservoir, where slightly opening the sluice gate (raising the price) barely diminishes the outflow. In contrast, elastic demand functions like a shallow, leaking pond—any adjustment is felt immediately, and the current, in this case the buyers, shifts toward the adjoining pond.
That “adjoining pond” represents the linchpin of market equilibrium: when a price hike in one species drives purchases of another, both products act as substitute goods perceived as equivalent by consumers, whereas if their demand curves move in unison, they constitute complementary goods.
Five Years of Data Across More Than 67,000 Supermarkets
The United States imported $32 billion worth of fish and seafood in 2022, accounting for 17% of total global seafood import value. Two-thirds of the volume purchased by U.S. consumers is channeled through supermarkets, concentrated primarily in frozen and refrigerated fillets. This retail channel represents the true competitive battleground between domestic aquaculture and imported products.
Until now, the available economic literature operated with aggregated categories—such as “fish” or “seafood”—or relied on outdated historical series. In the case of trout, quantitative evidence was virtually nonexistent; the sole estimate identified by the researchers originated from the United Kingdom. Regarding pangasius in the U.S., no dedicated analyses existed for the frozen fillet category.
Mantente siempre informado
Stay Informed
Únete a nuestras comunidades para recibir al instante las noticias, informes y análisis más importantes del sector acuícola.
Join our communities to get instant access to the most important news, reports, and analysis from the aquaculture industry.
Addressing this gap, the study’s authors processed weekly store-level NielsenIQ scanner data between September 2016 and August 2021. The dataset incorporated more than 67,200 retail outlets across more than 130 retail chains—including Walmart, Sam’s Club, and Kroger—spanning eight regions and 54 metropolitan areas. Although acquiring and processing microdata entails a substantially higher technical and financial investment than using regional aggregates, this approach accurately captures actual consumer behavior in the frozen display aisle.
Drawing on these records, the researchers formulated a demand model based on the Almost Ideal Demand System (AIDS) framework, which allocates total seafood expenditure across the five species and projects shifts in consumption shares in response to price fluctuations, promotional strategies, and disposable income.
The econometric estimation faced notable methodological challenges. Prices exhibited a direct correlation with demand—a phenomenon categorized in economics as endogeneity: price dictates sales, yet demand simultaneously exerts pressure on pricing. To resolve this, the research team introduced instrumental variables, including weekly wages, fuel costs, and consumer and producer price indices. In addition, serial autocorrelation and heteroskedasticity were corrected in the sales series. Finally, the trade promotions variable was retained because, despite moderate collinearity with price, it bolstered the model’s overall explanatory power.
Salmon: The Product with Pricing Power in the U.S. Market
The market landscape revealed by the data exhibits a striking asymmetry: salmon accounts for 68% of total expenditure among the five analyzed species, tilapia captures 19%, catfish takes 8%, pangasius represents 4%, and trout sits at a marginal 2%. In terms of average pricing, trout led as the most expensive option ($21.61/kg), followed by salmon ($19.67/kg), catfish ($13.71/kg), tilapia ($8.47/kg), and pangasius ($8.20/kg).
Bolstered by this market dominance, salmon displayed markedly inelastic demand—a 1% price increase contracts sales volume by a mere 0.76%—while lacking close substitutes on retail shelves. The authors attribute this resilience to sustained brand differentiation campaigns, value addition, targeted marketing, and a perceived price-quality premium that comfortably supports higher price tags.
Tilapia, meanwhile, registered a moderate price responsiveness (−0.865); however, this parameter lacked statistical significance, precluding conclusive inferences regarding its true demand behavior. This observation diverges from preceding studies that categorized tilapia as an explicitly price-inelastic commodity in the U.S. market.
Trout, Catfish, and Pangasius: When Every Cent Determines the Purchase
At the opposite pole of the market lie the three species characterized by markedly elastic demand, led by trout with an elasticity coefficient of −5.71, where a mere 1% price increase triggers a 5.71% contraction in purchase volume, followed by catfish (−2.83) and pangasius (−2.49).
For trout, cross-price interactions with salmon prove decisive: a 1% rise in salmon prices boosts trout demand by 5.12%, whereas the inverse effect is negligible, with salmon inching up only 0.14% when trout becomes costlier. The authors attribute this dynamic to the expansion of steelhead trout imports—the same rainbow trout, yet grown to larger sizes in marine net-pens in Norway and Chile—whose fillets match the caliber and pigmentation of salmon and whose steadily climbing shipment volumes and values from 2016 to 2022 established steelhead as a direct substitute when salmon prices escalate.
In the budget whitefish segment, competition is head-to-head: if tilapia climbs 1%, pangasius captures a 5.83% increase in demand share, while if pangasius becomes more expensive, tilapia regains 1.24%, contrasting with catfish, which serves merely as a weak substitute for tilapia (0.52). Finally, the study reveals a counterintuitive finding in that pangasius acts as a complementary good to salmon: when salmon rises 1%, pangasius demand drops by 4.19%, suggesting that the overall contractionary impact on consumer seafood budgets outweighs individual product substitution effects.
Catfish: No Obvious Substitutes… Until Purchasing Power Is Factored In
Prior research identified tilapia and salmon as direct substitutes for catfish; however, across the 2016–2021 time series, this relationship failed to materialize under conventional elasticity metrics. The correlation emerged solely after isolating the income effect—that is, simulating a scenario where consumer purchasing power remains insulated from price shifts. Under this compensated condition, catfish establishes itself as a notable substitute for both salmon (2.11) and tilapia (1.34).
In practical terms, the willingness to substitute exists, yet remains constrained by budget limitations. This dynamic closely aligns with another pivotal finding: catfish leads in expenditure elasticity. When consumers expand their aggregate seafood budget for these five species by 1%, catfish purchase volumes surge by 1.42%, followed by salmon (1.19), pangasius (1.17), trout (0.52), and tilapia (0.18). Consequently, an economic expansion predominantly favors catfish and salmon, whereas during an economic downturn, consumption migrates toward lower-cost alternatives like tilapia.
Trade Promotions Reveal an Uneven Impact
Tilapia, pangasius, and salmon sold a higher share of their volume under promotional pricing (between 18% and 20%), compared to catfish and trout (roughly 10% to 13%). However, the effect of these campaigns on expenditure share reached statistical significance only for salmon and trout; for tilapia, pangasius, and catfish, no measurable impact emerged, reinforcing prior literature on diminishing marginal returns from in-store promotions.
Strategic Implications for U.S. Fillet Marketers
The authors reach a definitive conclusion: faced with highly price-elastic demand, cutting prices offers no viable path for U.S. catfish and trout farmers, who already contend with stricter regulatory burdens and mounting cost pressures across feed, energy, labor, and capital.
In this environment, the recommended strategy centers on non-price differentiation—leveraging domestic provenance, superior sensory attributes, nutritional value, and sustainable practices, while engaging shoppers through QR-code farm traceability and reputable third-party quality certifications.
Furthermore, producers should tactically capitalize on competitor price swings, as catfish gains momentum when salmon or tilapia prices surge, and trout benefits from rising salmon costs; closely tracking these retail price movements and securing uninterrupted shelf placement remain paramount, particularly since inconsistent retail availability represents the foremost consumer barrier to purchasing domestic seafood.
Methodological Scope and Study Limitations
The study presents several constraints worth noting: the analysis is restricted to frozen and refrigerated fillets sold in supermarkets, excluding the foodservice (HoReCa) channel, which represents a substantial share of U.S. seafood consumption. Furthermore, it omits other potentially competing species and does not disaggregate regional divergences, prompting the authors to call for targeted research into specific metropolitan markets and advertising narrative efficacy.
Conclusion: Strategic Lessons from the Mississippi Delta
For the executive reviewing the cost structure that Tuesday morning at the processing plant, the study offers no silver bullets, but rather an unequivocal warning: when demand contracts at nearly triple the rate of price increases, directly passing rising costs on to consumers entails severe commercial risks while imported pangasius maintains pressure in the adjacent freezer and salmon sustains its sales velocity.
What must evolve, however, is strategic decision-making: monitoring salmon and tilapia price points, securing buffer inventory to capitalize on their price spikes, and articulating non-price value propositions are indispensable steps to reposition domestic fillets. Salmon required decades to cement the market leadership that now affords it pricing power without sacrificing market share; the broader aquaculture sector now holds the roadmap to navigate that very same transition.
Contact
Ganesh Kumar
Thad Cochran National Warmwater Aquaculture Center, Delta Research and Extension Center, Mississippi State University
Stoneville, MS 38756, USA.
Email: gkk27@msstate.edu
Reference (open access)
Kumar, G., Engle, C., & Sun, L. (2026). Responsiveness to price changes for major aquaculture products in U.S. retail markets. Journal of the World Aquaculture Society, 57(5), e70157. https://doi.org/10.1111/jwas.70157
Editor’s Note
What This Landscape Means for Salmon, Trout, and Tilapia Exporters to the U.S.
Although the original study centers primarily on domestic U.S. fish farmers, its empirical findings chart a valuable strategic roadmap for companies exporting fillets from Chile, Norway, Vietnam, Latin America, and beyond. The following analysis examines the commercial implications derived from these quantitative metrics, clearly distinguishing them from the authors’ direct recommendations.
Salmon exporters compete with a distinct structural advantage, as demand remains highly inelastic in the face of moderate price hikes and encounters no direct retail substitute. Furthermore, salmon is one of only two species where in-store promotions statistically expanded expenditure share, effectively capitalizing on consumer liquidity cycles. The critical metric to monitor, however, is that sharp price increases prompt a portion of buyers to substitute toward trout.
Trout and Steelhead: Capitalizing on Salmon Price Increases
For trout producers, raising prices represents the highest-risk commercial move in the retail freezer aisle. Their primary advantage stems from cross-price elasticity: every uptick in salmon prices promptly drives trout demand, making retail price monitoring and volume readiness during those windows the most data-aligned strategy. Furthermore, promotional campaigns proved effective for this species, which recorded the lowest share of discounted sales, revealing an untapped market opportunity; nonetheless, it is worth noting that the study analyzes trout in aggregate, leaving the link to imported steelhead as a qualitative inference by the researchers.
Tilapia: Head-to-Head Rivalry with Pangasius
Foreign trade in tilapia contends primarily against pangasius for market share, where rising tilapia prices allow pangasius to swiftly absorb that consumer demand, making the price gap the defining factor in retail turnover. Promotional discounts demonstrated no statistically significant effect, and the species barely expands during broader seafood budget increases, finding its commercial haven, as the authors note, mainly during economic downturns. With 2022 import volumes remaining 19% below the 2014 peak, competing strictly on price faces a clear ceiling, positioning origin differentiation, third-party certifications, and value addition as the essential path forward.
Pangasius: High Price Sensitivity and Close Linkage to Tilapia
Pangasius exhibits markedly price-elastic demand that remains strictly contingent upon its price spread relative to tilapia, and much like the latter, trade promotions yielded no statistically significant sales impact.
For any exporting nation, the overarching principle that the authors outline for domestic producers holds equally true: deliver non-price differentiating attributes—such as verified traceability, superior nutritional profiles, environmental credentials, and origin storytelling—while securing consistent retail replenishment, given that out-of-stock events remain a primary driver of customer attrition.

Editor at the digital magazine AquaHoy. He holds a degree in Aquaculture Biology from the National University of Santa (UNS) and a Master’s degree in Science and Innovation Management from the Polytechnic University of Valencia, with postgraduate diplomas in Business Innovation and Innovation Management. He possesses extensive experience in the aquaculture and fisheries sector, having led the Fisheries Innovation Unit of the National Program for Innovation in Fisheries and Aquaculture (PNIPA). He has served as a senior consultant in technology watch, an innovation project formulator and advisor, and a lecturer at UNS. He is a member of the Peruvian College of Biologists and was recognized by the World Aquaculture Society (WAS) in 2016 for his contribution to aquaculture.