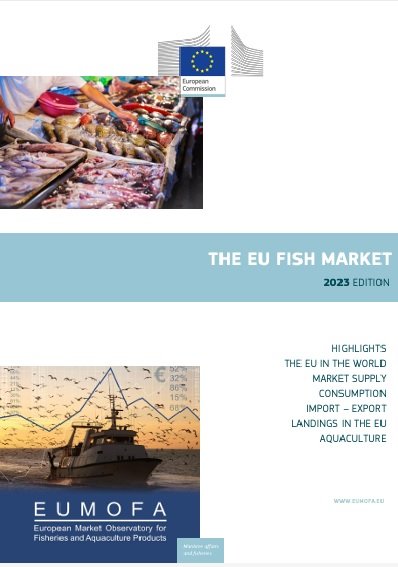
The ‘EU Fish Market‘ is a comprehensive analysis of the EU’s fishing and aquaculture industry conducted by the European Market Observatory for Fisheries and Aquaculture Products (EUMOFA).
Refer to this annual report to discover more about what is produced/exported/imported, when and where, what is consumed, who, and what the major trends are.
This edition is based on data available until September 2023, and you will find detailed and additional data in the EUMOFA database: by species, sales location, Member State, partner country.
3 Highlights from the 2023 Edition
Higher Prices, Less Consumption
In 2022, household spending on fish and aquaculture products in the EU-27 increased by nearly 11% compared to 2021, accelerating the upward trend since 2018. Inflation significantly impacted food prices, particularly fish, causing prices to rise over 10% between 2021 and 2022. As most fish supply comes from imports, this increase aligned with rising import prices. Inflation led to a significant decrease in domestic fish consumption, with volume dropping almost 17% in the EU’s most consuming countries between 2021 and 2022, according to Europanel/Kantar/GfK data.
Inflation Impact on EU Exports
The value of EU exports increased by 19%, reaching 8.1 billion euros. However, the volume continued the downward trend observed in 2021, decreasing by 5% to 2.3 million tonnes. Several factors influenced EU trade flows in 2022. The main factor was an increase in inflation, partly related to the COVID-19 recovery, causing increased demand and consequent price hikes. Additionally, the Russian aggression in Ukraine had a significant impact, increasing energy and production costs, contributing to global inflation that affected exchange rates.
Deterioration of EU Trade Balance
As the value of imports grew more than the value of exports, the EU’s trade deficit was 25%, 4.73 billion euros more in 2022 than in 2021. In the 2013-2022 decade, the deficit grew by 56% in real terms. All EU countries with deficits exceeding 1 billion euros experienced a worsening situation between 2021 and 2022. Most EU countries saw increases in the value of both exports and imports, while volumes decreased.
Increase in Apparent Consumption of Aquaculture Products
In 2021, the apparent consumption of fish and aquaculture products in the EU recovered, reaching about 10.60 million tonnes of live weight equivalent (EPV), marking a 2% increase from 2020. It was linked to a rise in aquaculture production, partially offsetting the decline in catches. In fact, the per capita apparent consumption of aquaculture products is estimated to have increased from 6.47 kg EPV to 6.80 kg EPV in 2021.
Key Dynamics of Major Species
Salmon
In 2022, EU salmon imports decreased by 3% compared to 2021, but their value increased by 28%, reaching a ten-year high of 8.4 billion euros. Norwegian salmon imports accounted for 83% of the observed value increase in 2022, with a 33% increase in their average import price compared to 2021. Salmon aquaculture production remained stable, which is unusual, given that from 2013 to 2022, it increased at an average annual rate of 5%, while wild salmon production fell considerably, mainly due to reduced catches of pink salmon.
Shrimps and Prawns
Representing 10% of the volume and 15% of the value of EU imports in 2022, shrimp experienced a 2% increase in import volume and a 17% increase in import value compared to 2021. In 2022, Ecuador, India, and Vietnam increased their market shares by 1% to 2% in volume and represented 89% of the increase in shrimp imports’ value. Argentina, on the other hand, lost around 3% of its market share from 2021 to 2022. Finally, cold-water shrimp represented 10% of the volume and 6% of the value, with 86% of its volume imported from Greenland.
Stay Always Informed
Join our communities to instantly receive the most important news, reports, and analysis from the aquaculture industry.
Cod
One of the most popular species among EU consumers. In 2022, Norwegian and Russian cod quotas in the Barents Sea decreased by 20%, and supply to the EU market dropped by 7%. The average price of cod products increased by 29%, rising from 5.05 to 6.53 €/kg, causing the value of imports to soar 20% above the 2021 value.
Tuna
In 2022, tuna represented 10% of the total volume and value of fish imported into the EU, with a 1% increase in volume and a 29% increase in value compared to 2021. Skipjack tuna represented 53% of the imported volume and 49% of the imported value, followed by yellowfin tuna, representing 32% of the volume and value imported.
Alaska Pollock
While its import volume remained stable in 2022, its import value skyrocketed by 31% to 986 million euros. The increase in import value is mainly due to a significant increase in prices.
Background
The ‘EU Fish Market’ is a comprehensive analysis of the EU’s fishing and aquaculture industry published annually since 2014. It is prepared by the European Market Observatory for Fisheries and Aquaculture Products (EUMOFA), a market intelligence service of the European Union developed by the European Commission. EUMOFA works to increase market transparency and efficiency, analyzes the dynamics of EU markets, and supports evidence-based policy formulation.
Reference (open access)
EUMOFA. The EU fish market – Edition 2023. 125 p.
Editor at the digital magazine AquaHoy. He holds a degree in Aquaculture Biology from the National University of Santa (UNS) and a Master’s degree in Science and Innovation Management from the Polytechnic University of Valencia, with postgraduate diplomas in Business Innovation and Innovation Management. He possesses extensive experience in the aquaculture and fisheries sector, having led the Fisheries Innovation Unit of the National Program for Innovation in Fisheries and Aquaculture (PNIPA). He has served as a senior consultant in technology watch, an innovation project formulator and advisor, and a lecturer at UNS. He is a member of the Peruvian College of Biologists and was recognized by the World Aquaculture Society (WAS) in 2016 for his contribution to aquaculture.

